THE USE OF COST-BENEFIT ANALYSES IN NORWAY AND SWEDEN: A COMPARISON1
Morten Welde
Norwegian University of Science and Technology, Norway Jonas Eliasson
Royal Institute of Technology, Sweden James Odeck
Norwegian University of Science and Technology, Norway Maria Börjesson
Royal Institute of Technology, Sweden
1. INTRODUCTION
Well-informed decision making
relies on access to all relevant information regarding the consequences of
proposed schemes. Large road projects in both Norway and Sweden are required
to undergo a full impact assessment aimed at assessing all impacts, negative
or positive and measurable in monetary terms or not, which are predicted to
occur if the project is implemented. In other
words, impact assessment is
a systematic illustration of all impacts that will take place
if a project is carried out. The impacts of a proposed road project could
be:
a) impacts that can be valued in monetary terms such as construction
costs, time, and accidents;
b) impacts that are not possible to value in monetary terms or
c) distributional impacts of political interest.
The cost-benefit analysis (CBA) represent the perhaps most important part of the impact assessment. CBA provides a methodical framework that aims to quantify and value relevant impacts in order to assess a project’s viability in economic terms.
Today, most European countries
use CBA in road transport appraisal.
CBA provide decision support by informing
decision makers of the economic consequences of carrying out a proposal. The
economic merit of projects are gauged through profitability measures such as
the -
* net present value; or
* benefit-cost ratio,
allowing projects to be ranked according to their economic
worthiness.
However, despite being an integral part of the planning process and despite the significant resources used for projects appraisal, several Scandinavian studies have indicated that the use of CBA in the decision making process may be limited (Fridstrøm and Elvik, 1997; Nilson, 1991; Nyborg, 1998; Odeck 1991, 1996). This is similar to conclusions in a study by Nellthorp and Mackie (2000) from the UK, but contrary to findings by McFadden (1976) and Gómez- Lobo (2012) from the U.S. and Chile which both found investment decisions to rely heavily on a positive CBA result. From a Scandinavian perspective an interesting exemption from the previous studies is Eliasson and Lundberg (2012) which found CBA results to have influenced project selection in the Swedish Transport Investment Plan 2010-2021.
The purpose
of this paper is
to study
and compare
the planning frameworks
of Norway and Sweden and
to investigate the role of cost-benefit
analyses in the
decision-making process by exploring how project selection is influenced by
the CBA. The paper is organised as follows.
Section 2 describes the planning process
and the appraisal methodologies of Norway and Sweden including values of
central parameters used in the CBA. Section 3 presents the data used in the
study and explores how project selection is influenced by benefit- cost
ratios.
Section 4 we offer some conclusions.
2. THE PLANNING PROCESS IN NORWAY AND SWEDEN
Transport planning in Norwegian and Sweden has several commonalities. Both countries make long term plans based on national strategic goals where individual projects that fulfil these goals undergo a thorough assessment; often based on a wider political process. Both countries have strong economic-rationalistic planning traditions which emphasize the use of analytical tools such as models, forecasts and software programs. There is a long standing tradition in the use of CBA in both countries and the CBA approaches are based on very similar principles.
An important difference between Norway and Sweden is with regards to the organizational framework of the institutions that deal with transport planning.
· In Norway the Public Roads Administration is organised directly under the Ministry of Transport and Communication with regards to matters related to national roads.
· In Sweden the Swedish Transport Administration has a more independent role. These differences are manifested in the observed planning practices; Sweden has a more instrumental/rationalistic and expert driven planning processes whereas Norway has a more communicative and politically driven planning processes at different levels.
It should be noted that even though both countries use CBA in making their plans, different goal conflicts may imply that CBA alone is not decisive for the selection of project portfolios.
The approaches to CBA in Sweden and Norway are very similar to each other and, the development and improvement of the methods used follow each other very closely.
Table 1 presents the most important parameters and their values in the CBA guidelines of the two countries. The table shows the parameters that were used for the appraisal studies in the current paper.
Table 1: Some of the parameters used in Swedish and Norwegian transport-related CBAs
|
|
|
Sweden |
Norway |
|
Travel time savings |
Private trips <10 km |
5.9 EUR/h |
10.6 EUR/h |
|
Private trips >10 km |
11.7 EUR/h |
20,2 EUR/h |
|
|
Business trips |
31.7 EUR/h |
52.6 EUR/h |
|
|
Traffic safety |
Life |
2.57 MEUR |
4.18 MEUR |
|
Severe injury |
0.48 MEUR |
1.13 MEUR |
|
|
Light injury |
0.02 MSEK |
0,08 MEUR |
|
|
Emissions2 |
Carbon dioxide |
0.17 SEK/kg |
0,03 EUR/kg |
|
Particles |
1323 EUR/kg |
544 EUR/kg |
|
|
VOC |
7.83 EUR/kg |
- |
|
|
SO2 |
38.33 SEK/kg |
|
|
|
NOx |
4.14 SEK/kg |
6,92 EUR/kg |
|
|
General parameters |
Discount rate |
4% |
4,5% |
|
Appraisal period |
40 years |
25 years |
|
|
Cost of public funds |
1.21 |
1.20 |
Travel time savings could make up over 80% of estimated benefits in road projects. Table 1 shows that the values of travel time were considerably lower in Sweden than in Norway.
Traffic safety benefits are often one of the most important criteria when assessing infrastructure projects and are among the main reasons for investing in new and improved roads. Both countries emphasize the importance of improved transport safety in their transport plans. Again we notice that the unit values of casualties differed, with Norway valuing a statistical life some 60% higher than Sweden.
Investment in roads and other transport infrastructure lead to changes in environmental burdens and damages. Environmental impacts, both locally, regionally and globally, cause utility losses (or gains) and are therefore important to consider when assessing the impacts from transport investments. Here we notice that the unit values of emissions were considerably lower in Norway than in Sweden. Given a higher income level in Norway than in Sweden, this is counterintuitive. It could be an indication of different preferences between the two countries or that unit values in Sweden are set high so as to support political objectives for reductions in emissions.
The discount rate can have a crucial impact on the profitability of a project. In Norway the discount rate was 8% until recently, but was reduced to 4.5% at the time when the analyses for the current transport plan was carried out. At the same time, the Swedish discount rate was 4%.
The appraisal period is the time considered in the analysis and includes the planning and construction phase and the operational phase. It determines the time period in which costs and benefits are taken into account and for which a forecast is needed. In the analyses presented in this paper, Sweden used an appraisal period of 40 years. Norway differed between an appraisal period and a life span of the utility – benefits and costs were forecasted and discounted over 25 years after which a residual value equal to 15/40 of the construction costs were added.
Olsson et al. (2012) studied the consequences of differences in CBA- methodology in seven countries and found that methodological differences caused benefit-cost ratios for the same project to vary considerably. We have not attempted to investigate whether the differences in unit prices and general economic parameters in the CBA methodologies of Norway and Sweden would cause different results and hence different rankings of projects. However, and as illustrated by Table 1, while Norway applied higher values for valuations of time and safety, Sweden used a lower discount rate and a longer appraisal period. This could lead to different estimates of costs and benefits for identical projects. The proportion of profitable projects in the two countries and their rankings should hence be interpreted with some care.
Since the appraisals carried out for the transport plans studied in this paper, both countries have revised their CBA guidelines. The main changes are increased unit prices for travel time and accidents, a reduction in the discount rate to 3.5% and 4.0% for Sweden and Norway respectively and an increase in the Norwegian appraisal period to 40 years.
3. THE USE OF COST BENEFIT ANALYSIS
In this study we have used databases compiled for the Swedish Transport Investment Plan 2010-2021 and the Norwegian National Transport Plan 2014- 2023. Our analysis deals with the administrations’ proposals. The subsequent Parliamentary debate and the final plans presented by the governments usually differs from that of the administrations – normally by the inclusion of more projects than what the administrations’ budget limits would have allowed.
The Swedish database includes 417 projects out of which 67 were already pre-selected for implementation by the government and 135 recommended by the administration. The Norwegian database includes 216 projects for which full socio economic appraisals were available. Of these, 35 were pre-selected and further 18 were recommended by the administration.
In the paper we use the net benefit-investment cost ratio (NBIR) as a measure of cost efficiency. The NBIR is similar to the benefit-cost ratio but the nominator is the net benefits rather than the present value of the costs. If the NBIR is above 0, the project is profitable from a socio economic perspective.
Table 2 summarizes some characteristics of the projects in the study. As the table shows, the Norwegian projects are more expensive on average than the Swedish ones. This seems to be because the Swedish projects are usually smaller; in Norway, several such small projects would have been combined into larger packages and treated as one project.
Table 2: Summary of project characteristics
|
|
|
Norway |
Sweden |
|
Number of projects |
All candidates |
216 |
417 |
|
Selected by Govt. |
35 |
67 |
|
|
Selected by Adm. |
18 |
135 |
|
|
Total project cost (bill. euros) |
All candidates |
27.0 |
14.7 |
|
Selected by Govt. |
3.6 |
8.1 |
|
|
Selected by Adm. |
2.3 |
2.9 |
|
|
Average project cost (bill. euros), excl. 5 most expensive |
All candidates |
102.2 |
23.2 |
|
Selected by Govt. |
104.4 |
46.3 |
|
|
Selected by Adm. |
91.9 |
21.4 |
|
|
Average NBIR |
All candidates |
-0.18 |
0.36 |
|
Selected by Govt. |
-0.18 |
0.50 |
|
|
Selected by Adm. |
-0.17 |
0.83 |
|
|
Share of projects with NBIR>0 |
All candidates |
31% |
56% |
|
Selected by Govt. |
34% |
66% |
|
|
Selected by Adm. |
22% |
74% |
More interesting is the difference in ratio of projects with a positive NBIR. On average, Norwegian projects have a negative NBIR whereas the average Swedish road project has a NBIR of 0.36. This explains why a majority of the Swedish projects in the database are profitable while only about a third of Norwegian projects are. In other words, there are many more projects in the Norwegian database that provides poor value for money than in the Swedish one. Whether this is because the Norwegian administration have selected poor projects for appraisal or because Norwegian projects generally struggle to deliver a positive return is uncertain, but it is reasonable to assume that the demanding Norwegian topography, low population density and traffic levels could explain why net present values of planned road projects often turn out to be negative.
The most striking difference between the two countries, however, is that while the share of Swedish projects with a positive NBIR is higher both among projects (pre-) selected by the government and projects selected by the administration, there is no such link in Norway. In fact, only 22% of the projects selected by the Norwegian administration have a positive NBIR. In other words, the Norwegian administration managed to find projects which, on average, performed worse than the average of all the projects in the database. This indicates that NBIR seems to affect project selection in Sweden, but probably not in Norway.
In order to explain the first observation, that the average NBIR is so much lower in Norway than in Sweden, the cumulative distributions of NBIRs are illustrated in Figure 1. The figure shows what the maximal average NBIR would be given a certain budget. In other words, this would be the attained NBIR if all projects were ranked according to their NBIR, and then the best ones up to a given budget were selected.
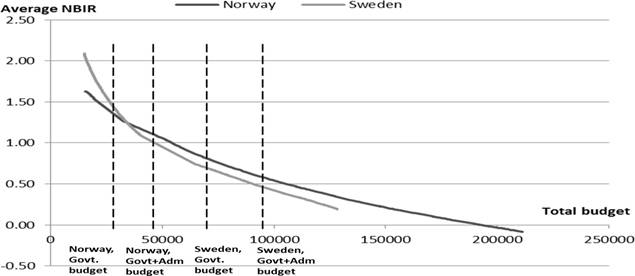
Figure
1: Distribution
of NBIRs:
maxinal total
NBIR within
a given
budget. The
budgets are
given in NOK and SEK, respectively (1 NOK =
1.14 SEK).
The dotted lines show the maximal attainable average NBIRs given the budgets
of the governments and administrations. For example, had the Norwegian
Government chosen to spend its budget (28 MNOK) (Million
Norwegian Kroner) on the highest-NBIR projects, it had attained an
average NBIR of 1.32. Similarly, had the Swedish Government and
Administration spent their combined budget (95 MSEK) (Million
Swedish Kroner) on the highest-NBIR project, the average NBIR of
their plan would have been 0.48.
The figure reveals an important finding: the Norwegian candidate list contains many more inefficient projects than the Swedish list. The top ends of the two lists (the most cost-efficient projects) exhibit a similar NBIR distribution in both countries. This explains the difference in average NBIR in the two countries. Hence, the reason for the difference in average NBIR is not that Norwegian projects generally have lower NBIRs; the difference is that a lot of low-NBIR projects are included in the Norwegian candidate list of candidates. The cost of all projects with NBIR>0 is similar – 73 billion SEK in Sweden and 72 billion NOK in Norway. But while the Swedish candidate list contains suggested investments with a total cost of 128 billion SEK, the Norwegian list contains investments with a total cost of 211 billion NOK; in other words, there are many more inefficient projects on the Norwegian list.
To further test and explore how costs and benefits affect project selection, binary logit models were estimated for each of the four decision makers. After extensive testing, the models include four variables: NBIR+; NBIR>0; log(investment cost); and the ratio of safety benefits to accessibility benefits. Projects are split in two size segments: “large” projects are the 40% most expensive projects (>1300 MNOK and >130 MSEK, respectively), while “small” projects are the remaining 60%. Table 3 shows the estimation results.
Table 3: Estimation results: binary logit models of project selection (variable explanation in text)
|
Variable |
Norway |
Sweden |
||||||
|
Govt. |
Adm. |
Govt. |
Adm. |
|||||
|
Parameter |
t-stat |
Parameter |
t-stat |
Parameter |
t-stat |
Parameter |
t-stat |
|
|
NBIR+ small |
ns |
- |
ns |
- |
ns |
- |
0.728 |
2.0 |
|
NBIR+ large |
ns |
- |
ns |
- |
ns |
- |
1.151 |
2.5 |
|
NBIR>0 small |
ns |
- |
ns |
- |
1.458 |
2.7 |
0.369 |
1.8 |
|
NBIR>0 large |
ns |
- |
ns |
- |
ns |
- |
0.882 |
2.0 |
|
Log(cost) |
ns |
- |
ns |
- |
1.163 |
5.0 |
ns |
- |
|
Safety/acc. |
ns |
- |
ns |
- |
-0.086 |
-2.0 |
ns |
- |
|
Const small |
1.946 |
1.1 |
1.968 |
5.1 |
8.060 |
5.7 |
1.206 |
4.0 |
|
Const large |
1.341 |
1.0 |
1.687 |
2.5 |
7.921 |
7.1 |
1.292 |
5.5 |
For the Norwegian project selection, we were unable to find any specification that revealed any influence of NBIR on project selection. In fact, we were unable to find any project characteristic at all with a significant impact on project selection, neither the government’s selection, nor the administration’s. We tried different specifications involving accessibility benefits for person trips and freight respectively, safety benefits, maintenance costs, investment costs and traffic levels, but none of them, nor any combination of them was significant. For example, neither the ratio of investment cost to traffic (i.e. spending per traveller), nor the ratio of benefits to traffic volume (the absolute improvement per traveller) were significantly correlated with project selection. Neither were any of the different kinds of benefits, nor the ratio of different benefit types to each other, nor project cost alone, nor total benefits, nor total net benefits. Hence, we can only conclude that project selection in Norway is apparently decided by processes and considerations unrelated to any documented investment characteristics we have access to.
The analysis of the Swedish government’s project selection reveals that the government primarily selects large projects. This makes intuitive sense: the larger the project is, the greater is usually the political interest. Surprisingly, there is no such tendency in Norway: the Norwegian government is just as likely to select small projects as big ones. The NBIR does not seem to influence the Swedish government’s selection for large projects. For small projects, however, the government selection probability increases if the NBIR is positive. Finally, the government shows a tendency to put more weight on accessibility benefits compared to safety benefits than the default relative weights in the CBA. Contrary to our expectations, we did not find any preference for person vs. freight benefits.
The Swedish Transport Administration’s selection is clearly affected by the NBIR: selection probability increases significantly with the NBIR. This effect gets stronger the more expensive projects are. In this final model specification, projects are only split in two size segments with respect to project cost, but this effect is evident even when increasing the number of segments. There is a threshold effect at NBIR=0: for negative NBIR values, the NBIR does not affect project selection significantly. Once NBIR>0, the selection probability jumps, and then continues to increase with the NBIR.
Interestingly, no particular preference for safety versus accessibility benefits is revealed. Further tests show an even stronger result: based on the Administration’s project selection, implicit relative weights of five different benefit types can be estimated – person accessibility, freight accessibility, safety, emissions and maintenance. These weights turn out to be so close to each other that the hypothesis that they are equal cannot be rejected. In other words: in their project selection, the Administration actually uses implicit weights on the different types of benefits that are consistent with the valuations in the CBA guidelines.
4. CONCLUSIONS
In this paper we have compared the planning frameworks of Norway and Sweden and investigated the role of cost-benefit analyses in the decision- making process.
Transport planning in Norway and Sweden has many common features. Both countries use long-term strategic planning where economic appraisals play an important role. The methodologies for cost-benefit analyses are almost analogous and resent revisions have increased the similarities.
There is, however, a major difference related to the use of CBA in the ranking and selection of projects to be included in the transport plans recommended by the administrations. In Sweden, economic viability is found to be a determining factor in the selection of projects. In Norway, economic viability seems to have no significant impact.
Even if there is a higher ratio of economic viable projects in Sweden than in Norway, the potential economic benefits from road investments in the two countries are similar. If Norway was to prioritize according to the net present value per budget kroner, then the gains for Norway from investments would be as high as the Swedish gains given the same total budget.
Based on these observations we concluded that Sweden has a more systematic use of CBA when prioritizing road projects as compared to Norway. Unprofitable projects are eliminated at an earlier stage in Sweden. In other words, economic profitability matters more in Sweden. In the case of Norway there is no statistical evidence to support that this is the case when projects are prioritized in the national transport plan. It is therefore clear that there are other factors than economic profitability that may explain how projects are prioritized in Norway. To uncover what factors this might be is beyond the scope of this study, but if these other factors are important, they should be documented as much as the results of CBA. The use of public resources should be transparent.
Our overall conclusion in this paper is that Norway has a lot to learn from Sweden in terms of systematizing the planning process and the use of welfare maximizing principles when prioritizing projects. For an overview and ranking of a large number of projects, CBA is a useful tool.
BIBLIOGRAPHY
Eliasson, J., Börjesson, M., Odeck, J. and Welde, M. (2013) The impact of cost-benefit analyses on transport investment decisions, paper submitted to the Journal of Public Economics, September 2013.
Eliasson, J. and Lundberg, M. (2011) Do Cost-Benefit Analyses Influence Transport Investment Decisions? Experiences from the Swedish Transport Investment Plan 2010–21, Transport Reviews, 31 (1) 1-20.
Fridstrøm, L. and Elvik, R. (1996) The barely revealed preference behind road investment priorities, Public Choice, 92 (1-2) 145-168.
Gómez-Lobo, A. (2012) Institutional Safeguards for Cost Benefit Analysis: Lessons from the Chilean National Investment System, Journal of Cost- Benefit Analysis, 3 (1) 1-30.
McFadden, D. (1976) The revealed preference of a government bureaucracy: empirical evidence, The Bell Journal of Economics, 7 (1) 55-72.
Nilsson, J.-E. (1991) Investment Decisions in a Public Bureaucracy, Journal of Transport Economics and Policy, 25 (2) 163-175.
Nyborg, K. (1998) Some Norwegian politicians’ use of cost-benefit analysis,
Public Choice, 95 (3-4) 381–401.
Odeck, J. (1991) Om nytte-kostnadsanalysens plass i beslutningsprosessen i vegsektoren, Sosialøkonomen, 3, 10–15.
Odeck, J. (1996) Ranking of regional road investment in Norway: does socio- economic analysis matter? Transportation, 23 (2) 123–140.
Olsson, N.O.E., Økland, A. and Halvorsen, S.B. (2012) Consequences of differences in cost-benefit methodology in railway infrastructure appraisal─A comparison between selected countries, Transport Policy, 22 (1) 29-35.
Welde, M, Eliasson, J., Odeck, J. and Börjesson, M. (2013) Planning, analytic tools and the use of cost-benefit analysis in the transport sector in Norway and Sweden, Concept report no. 33, Concept Research Programme, Norwegian University of Science and Technology, Trondheim.
NOTES
1 This paper is based on the research report “Planning, analytic tools and the use of cost-benefit analysis in the transport sector in Norway and Sweden” (Welde, et al., 2013) prepared for the Concept Research Programme at the Norwegian University of Science and Technology in Trondheim. The paper also includes material from a paper recently submitted to the Journal of Public Economics (Eliasson et al., 2013).
2 Values depend on geographical area (except for carbon dioxide). The values in the table relate to the central parts of Stockholm